Welcome to the website of Science Dynamics - a project of Proverbs, a.s.
")
")

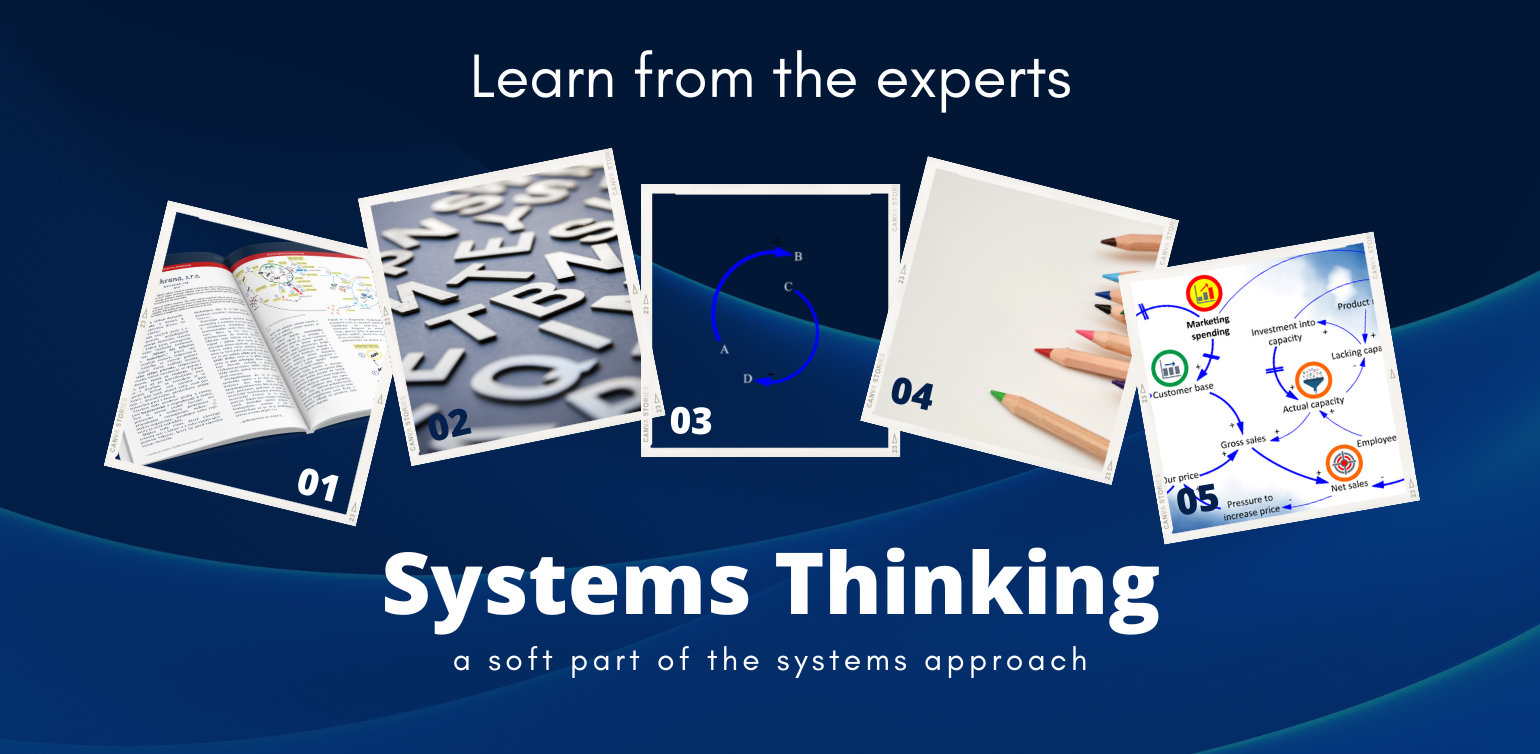
Systems Thinking
Those few of you who speak Czech can learn Systems Thinking from our book. For those who speak other languages, there are our courses, the Science Dynamics Review magazine, and other information resources on these pages. Interesting articles can also be found on The Systems Thinker.
If we borrow some of the text from the Systems Thinking Guide, we find that we and the behavior of everything around us can be viewed with varying degrees of detail. Most often we react to environmental and internal events. At this level, we are unable to determine what triggered these events, whether they will recur, and whether they can be prevented if they are negative or triggered as often as possible if we benefit from them.
Figure 1 Levels of detail view of the internal and external world - the system pyramid.
The levels of perception can be represented by Anderson and Johnson as the pyramid in Figure 1.
The topmost layer corresponds to a static image - an event oriented in a specific moment of time and space. It expresses the past, something that happened, say, a second ago, that was captured and preserved in memory or on some medium. In our picture it is a happy moment in the life of a mature couple, but it does not have to be a photo as such. This includes a balance sheet or scorecard, an accident report, a marriage certificate, a court order - anything that comes to mind that refers to the event(s). The chart expands with depth.
If we want to understand the behavior of the world around us and ourselves better, so that we don't have to react blindly, we try to notice the patterns of behavior that the world around us produces. We either store them in memory in the form of mental models, or we can plot them on a time graph. From the patterns, we then infer how the parameter under observation will evolve in the future. At the event level, we asked, "What happened?" and got an answer referring to a specific point in time, the pattern level implies a different query. "How did it evolve?" or "What behavior does it exhibit?" The result is then a time graph, or perhaps a movie - a photograph alone (unless it's a snapshot of a time graph) is no longer enough. You may be wondering why we don't stop at patterns. Is there any point in digging deeper into the pyramid? After all, the introduction of temporal patterns of behavior is already a significant step forward in understanding what is going on. But it often happens that the assumption of further development does not come to fruition, the parameter goes in a completely different direction.
If we ask what caused the parameter to move differently than before, the answer is obvious. The system structure is responsible for the behavior of all parameters in all real systems. The way in which the parameters are connected then generates the behavior we observe at the pattern level and eventually at the event level.
So if we want to influence the resulting behavior, we must somehow influence the system structure. We have three options when acting. The first and most commonly used approach is trial and error. It has a number of advantages - we don't have to look for any structure, we deal with event data, and we may hit the right place at the right time. Our decision may trigger the necessary changes, or it may not cause enough damage to be reflected in the behavior of the system. This is not unusual. This is how many organizations operate - despite their leadership. An old Czech proverb says, "Even a blind chicken finds a grain." Why shouldn't we find it too? The second approach can be called pseudo-systemic. It consists in an attempt to map and manage by "scientific means" which, given the methodology used, have little to do with reality and science. These are the procedures that will be drummed into you in economics courses of all kinds, starting with statistics, continuing through econometrics and (almost) ending with qualitative methods. Notice how tolerant we are. I am not even mentioning "strategic" management based on "case studies" and benchmarking, which became in its time a popular basis for formulating new management practices.Those methods are static and so fall in the upper tiers of the pyramid, as they are event or behavioral pattern oriented.
Thus, if we really want to understand the causes of behavior, if we need to change the observed behavior, to prevent undesirable developments, or, on the contrary, to make the system behave as desired, it is necessary to learn to uncover the system structure. And Systems Thinking is precisely the tool that will enable us to do just that.
Thus, if we really want to understand the causes of behavior, if we need to change the observed behavior, to prevent undesirable developments, or, on the contrary, to make the system behave as desired, it is necessary to learn to uncover the system structure. And Systems Thinking is precisely the tool that will enable us to do just that.
The opening figure for this article and the example on the right outline the process by which the system structure is revealed and expressed.
- 1. Every project begins by asking a question to which we seek an answer. In the systems approach (in Systems Thinking and System Dynamics), it is always essential not to model a system, but always model a problem. The systems structure in Systems thinking is expressed by the so-called Causal Loop Diagram (CLD).
- 2. The diagram consists of two types of elements - parameters and oriented connections - arrows. Thus, we are not looking for the structure of the enterprise, but, for example, for the structure that generates the profit of the enterprise that we want to increase. In fact, by asking the question, we set the boundaries and the level of detail of the diagram. Our efforts end when we express a structure capable of answering the question we have asked. Without the question, we will keep asking: "Do we have enough elements in our diagram?" and our job will never be finished.
- 3. The arrows express not only which parameter affects another parameter, but also the tendency of the relationship. The arrows have a plus or minus sign next to their heads. If the influencing parameter increases the rate of change or contributes to an increase in the value of the influenced parameter, we indicate a plus.
- 4. For example, the higher the price, the higher the sales. You may start to argue that this is not the way to say it, but please read on. Further, if we are selling a non-exclusive product, the higher the price, the less attractive our price and the fewer customers willing to buy our products. We write minus to the arrow from price to attractiveness. The fewer customers, the lower the sales, or in other words, the more customers, the higher the sales, we write plus and so on until the diagram is finished.
- 5. We then work with the diagram, alone or in a team, and can use it to explain the patterns of the systemic structure behind our profit behavior and the events that have and will affect profit. If the diagram is simple, we can simulate its behavior mentally and infer the impact of key parameter setting decisions. This is where the role of Systems Thinking ends.

Figure 2 The process of creating a causal loop diagram from the story of the enterprise.
Mental simulation of complex diagrams is impossible, so for the next steps we must move into the realm of System Dynamics. If you are interested, learn the practices of Systems Thinking with our books or in our courses.